In “One of the most important numbers when measuring veterinary practice success,” we used an analogy to explain that “net change in active patients” is like your bank balance — with a balance on the first day of the month, deposits and withdrawals, and a balance on the last day of the month. The difference between the last day and first day is your net change.
While net change in active patients isn’t the only number your practice’s success depends upon, it’s one of the most important ones. It reflects your practice’s growth, and knowing that your practice is growing can alleviate a lot of pressure. Let’s calculate the net change in active patients.
Numbers you’ll need
- Active patients on the first day of the month: On the first day of the month (or the last day of the previous month for simplicity), how many patients had a transaction in the practice in the last 18 months?
- New patients (inflow): How many patients had a first-ever transaction in the practice this month?
- Returned patients (inflow): How many patients haven’t been in for 19+ months and suddenly had a transaction in the practice this month?
- Deceased patients (outflow): This is self-explanatory. These pets won’t come to the practice anymore.
- Inactivate patients (outflow): Perhaps the client has moved or changed practices or it’s been more than 36 months since the client last brought the patient in. These patients should be marked as inactive in your system and removed from your active patient count.
- Lapsed patients (outflow): This is the most complicated number to calculate in the entire formula. Lapsed patients are patients you saw 18 months ago who didn’t come into the practice last month. This month represents the 19th month since their last visit and they need to be removed from your active patient count.
How to calculate the net change in active patients
Active patients (start of the month)
+ New patients
+ Returned patients
– Deceased patients
– Inactive patients
– Lapsed patients
Active patients (end of the month)
– Active patients
= Net change in active patients
An example calculation
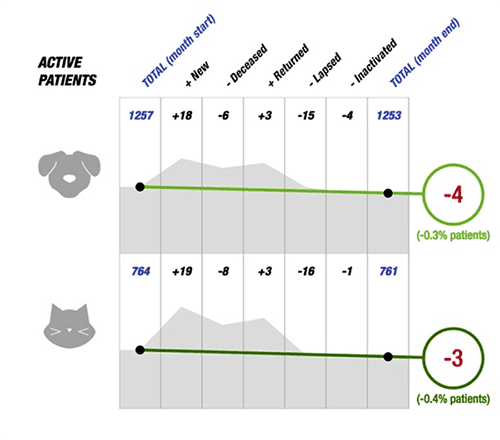
Below are two examples of these calculations from real practices: one where the net change in active patients for the month is negative (the practice is losing opportunities) and another where the net change is positive (the practice is growing and gaining opportunities).
|
Example 1 This practice shrank this month. The number of canine and feline patients at the end of the month was less than the number of patients at the beginning of the month. It’s less than 0.5% for each of the canine and feline categories, but, if sustained at that rate, it represents a contraction in the opportunity to provide service. |
 |
|
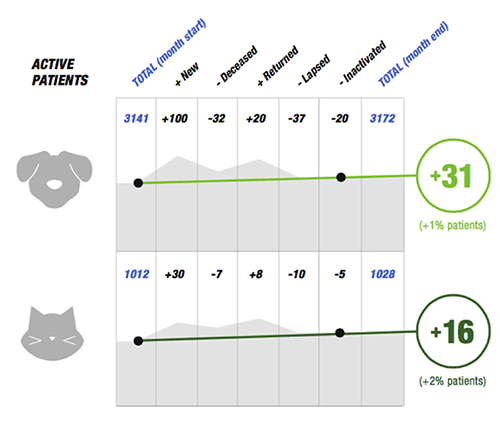
Example 2 The number of canine and feline patients at the end of the month is more than the number of patients at the beginning of the month. If this is sustained month after month, this practice has a greater opportunity to provide service to their client base. |
 |
Use your data to create trend lines and monitor your growth
After you’ve calculated the net change in active patients for several months, you can create a trendline of the number. Imagine watching your practice grow or contract monthly. The net change in active patients trendline can serve as an early warning mechanism if things take a turn. The trendline can let you know that you’re focusing on the right things and bringing your patients in and not letting them lapse.
Here’s one last graph that looks at a 24-month trend of a practice that grows, on average, by 68 patients a month — about 1.7% a month on a patient base of approximately 4,000 active patients.

Knowing whether your practice is growing or shrinking — not in terms of revenue but rather in the number of clients you can serve — is essential. Most of the numbers you need can easily be accessed through Vetsource’s Practice Overview Report. Contact a Vetsource rep today to learn more.