It’s no secret for those in the veterinary industry, practice management software data, aka PIMS data, can get very messy.
It’s far too easy to end up with lots of different names for things and codes that come and go. Perhaps an enterprising practice manager initiates a PIMS clean-up and beautifully recategorizes half of the PIMS codes but then a staff member is out sick for weeks and the manager doesn’t have time to finish. Or maybe last year your practice changed its vaccine protocol from 1 year to 3 years and now you’re not sure how to find out if you have more or fewer patients who are covered.
Sound familiar? No problem, something called data normalization is here to help.
“Normalization, or the process of organizing data into meaningful, useful categories, is the key to taming PIMS data.”
We at VetSuccess use normalization to unlock answers to questions like the one above. It’s what lets us compare your old protocol compliance to your new protocol compliance and compare your practice’s compliance to the national average. It’s also what lets us compare your vaccine revenue to your practice’s revenue overall.
To use a favorite VetSuccess phrase, it’s what lets us make an apples-to-apples comparison.
Apples, practice management, and normalization

Apples have a lot of characteristics: color, shape, stem length, number of seeds…the list goes on and on!
There are tons of things we could measure about apples, but most of those don’t matter for any given apple-related task. For example, to bake a pie, you need to know about sweetness and crispness — everything else just gets in the way.
Think of data normalization as the process of smoothing away the characteristics that aren’t relevant to the task at hand so that we can better investigate the characteristics that are.
But you aren’t trying to bake a pie — at least, not at work. You’re trying to run a veterinary practice. You’re keeping tabs on all kinds of things that can be measured about a practice, but not every characteristic is useful for every task.
Take heartworm compliance as an example.
When you want to know how many patients are covered by a heartworm preventive, it doesn’t matter whether they’re covered by Heartgard® or Trifexis®. It doesn’t matter how many doses were free or which provider prescribed them or if you were still using the old TRI1001 code to invoice Trifexis® Pink or the new TRIF1. Those things might matter in other contexts, but not this one.
Normalization lets us smooth away the distinction you (rightly!) make in your software between Trifexis® Orange and Trifexis® Blue and instead just tell you how many of your patients are covered. (When you want to know how many of your patients who weigh between 40.1 and 60 lbs are covered, then we can talk about Blue.)
Turning apples into pie with normalization
So how does this kind of normalization actually happen? How do we turn all the practice software codes into useful information?
Magic! Not really. It’s a combination of artificial intelligence and good ol’ fashioned human intelligence.
First, we ask a machine learning model to read the codes and assign each one to a category like Exams or Drugs and Medications. The model can tell us not only whether a code belongs in Drugs and Medications, but also if it’s a derm product, an otic, a pain medication or a parasiticide. It can even tell you the brand.
Next, we bring in the humans. A very smart human with veterinary practice experience (like a technician or nurse) reviews the machine’s work and helps it with things it’s still learning how to do. Humans give the machine corrections to help it do an even better job. That’s the “learning” part of “machine learning.”
This normalization process is intrinsically satisfying to those of us with a degree in math, but for everyone else there are tangible benefits, too.
“We need normalization to do any kind of comparison. “]
It’s one thing to see your forward booking percentage for last month, it’s another to know if that number means that you’re doing well.
There are two ways to find out:
- Use a trendline to compare how you are doing now to how you were doing before.
- Use a benchmark to compare how you are doing now to how others are doing now.
Normalization lets us build trendlines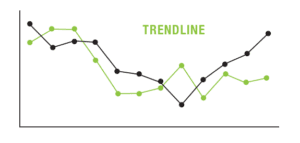
A trendline measures the same thing every month, year after year.
It lets you see if January was better than December and if January this year was better than January last year. Plus, when you make a change, a trendline can show you if your change has really moved the needle.
Let’s say your practice decided to really educate clients on the importance of wellness bloodwork this year.
Data normalization allows you to measure the percentage of your patients who are getting that bloodwork regardless of species-specific bloodwork codes or other distinctions you make in your software. A wellness-bloodwork trendline shows that percentage both before and after the change, so you know whether your education efforts have been effective.
Normalization also lets us build benchmarks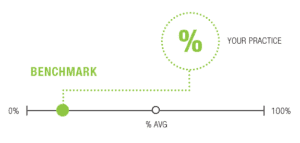
A benchmark measures everyone the same way, at the same time to create a standard that anyone can compare themselves to. Data normalization allows for benchmarking between different practices, regardless of what products a practice uses or the individual codes they describe them with.
Suppose you want to know if your practice’s distemper vaccine compliance is good.
You offer both the DHPP vaccine and the DHPP+Lepto. You can guess by now that normalization lets you see how many patients are covered regardless of which vaccine they got, but we can go one step further. When everyone else’s data is normalized too, you can compare your percentage of protected patients with an average of your peers. That average can include practices that use the DHPP+Lepto+Lyme, the DHPP+Rabies, or any other combination vaccine.
Normalization powers practice analytics
Data normalization is a foundation.
It’s the basement you dig before you build your dream house. It’s a long, geeky math word for describing how to focus on what’s relevant and smooth away what isn’t so you can get clear answers to questions that matter.